
Research Methodology
Visualisations in Professional Practice
In psychotherapy, counselling and coaching diagrams are used to illustrate theoretical models and processes of practice. Cognitive-behavioural therapy (CBT), for example, relies heavily on diagrams that depict the interaction between thoughts, emotions, and behaviours (Beck, 2011). Similarly, systemic family therapy has made use of genograms, circular questioning diagrams, and network maps to illustrate relational dynamics (Minuchin, 1974). In management and organisational development, flowcharts, pyramids, and matrices are ubiquitous tools for simplifying complexity and supporting decision-making, for example the SWOT analysis (Gurel & Tat, 2017) or Maslow’s (1943) pyramid of needs.
In all of these contexts, diagrams serve several overlapping purposes. They communicate processes quickly, create shared language between practitioners and learners, and serve as scaffolds for practice. They can also carry rhetorical power: a well-designed visualisation can convey authority and legitimacy, especially in academic or professional contexts where abstract ideas need to be made concrete. In the coaching world, diagrams also fulfil marketing and branding purposes: Erickson’s arrow (Erickson Coaching International, 2025), Design Thinking’s double diamond (Design Council, 2005) or Co-Active’s coaching model (Kimsey-House et al., 2018) come to mind.
The Challenge of Visualising Solution Focused Practice
SF was originally developed as a minimalist, pragmatic approach that emphasized listening carefully to clients’ language, amplifying their resources, and co-constructing preferred futures (de Shazer et al., 2007). Its founders resisted complex theoretical models explaining clients’ experience and behaviour, emphasizing instead what worked in practice. As a result, SF has often been described as “anti-theoretical” or “post-theoretical” (Iveson et al., 2012) regarding theories about clients. SF does, however, have a strong theoretical foundation in social-constructionism, postmodern thought and the philosophy of Ludwig Wittgenstein (de Shazer et al., 2007). The different understandings of ‘theory’ constitute a challenge to visualising the approach: is what is being visualised the practice, the theory (about the practice, not the clients) or both?
The SF community has produced a variety of visual models, particularly for teaching and dissemination. Over time, a rich set of diagrams has emerged, ranging from simple quadrants to elaborate metaphors such as wheels, tangos, galleries, pyramids, and diamonds. What is unusual, is that unlike other models (for example the 4-D model in Appreciative Inquiry, Cooperrider & Whitney, 2005, p. 16), SF does not have an ‘official’ visualisation. Steve de Shazer created a flowchart in his book Clues (de Shazer, 1988, p. 16), but to my knowledge it was not used as a standard visualisation.
The variety of the existing visualisations raises some interesting questions. In which way do visualisations illuminate or distort SF practice, if at all? Do they empower learners, or risk reducing SF to a series of steps? And how do different metaphors and structures reflect or contradict the ethos of SF?
Purpose and Research Questions
This article presents a literature-based review and critical reflection on visualisations of the SF process in theory and practice. It addresses three guiding questions:
-
What kinds of visualisations of SF exist in the literature and training materials?
-
How do these visualisations align with or diverge from SF principles?
-
What are the implications of using visualisations for practitioners, educators, and researchers?
By addressing these questions, the article aims to contribute to ongoing dialogue in the SF community about how best to represent, teach, and disseminate the approach while preserving its distinctive ethos.
Method and Approach
This article adopts a narrative literature review approach. Rather than conducting a systematic review with exhaustive database searches, the study draws on published diagrams and visualisations from books, articles, and practitioner materials widely cited in the SF field. It was generated from a literature review of SF works known to the author and a query on the SOLWorld Listserver. The corpus includes works from 1988 to 2023, covering English, German and French language sources.
Two broad categories of visualisations were identified:
-
Quadrant models, which use two-by-two matrices or cross-shaped structures to orient attention, map practitioner stance, or classify conversational dimensions.
-
Flow and process models, which depict the unfolding of conversations, often using metaphors of movement, cycles, or structures.
Each model was examined in terms of its historical context, pedagogical use and theoretical assumptions.
Quadrant Models
Quadrant models have been especially prominent in organisational and coaching contexts, where the two-by-two format is familiar and widely used. They are therefore a relatable format for presenting a model easy to adopt in these environments.
Albert Model (Jackson & McKergow, 2007, p. 3)
__from__b_563399_.png)

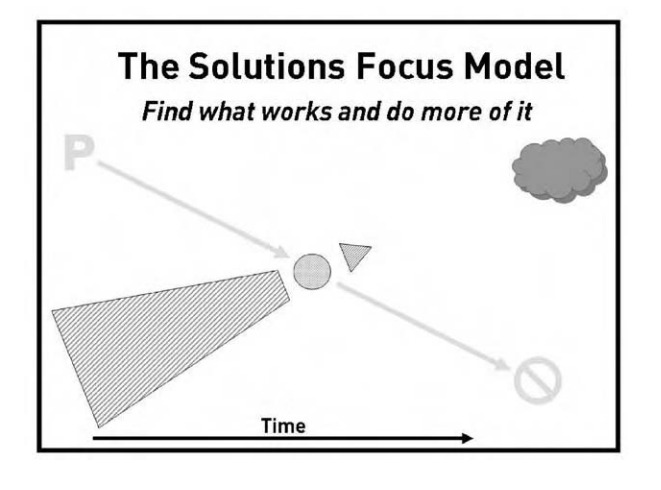
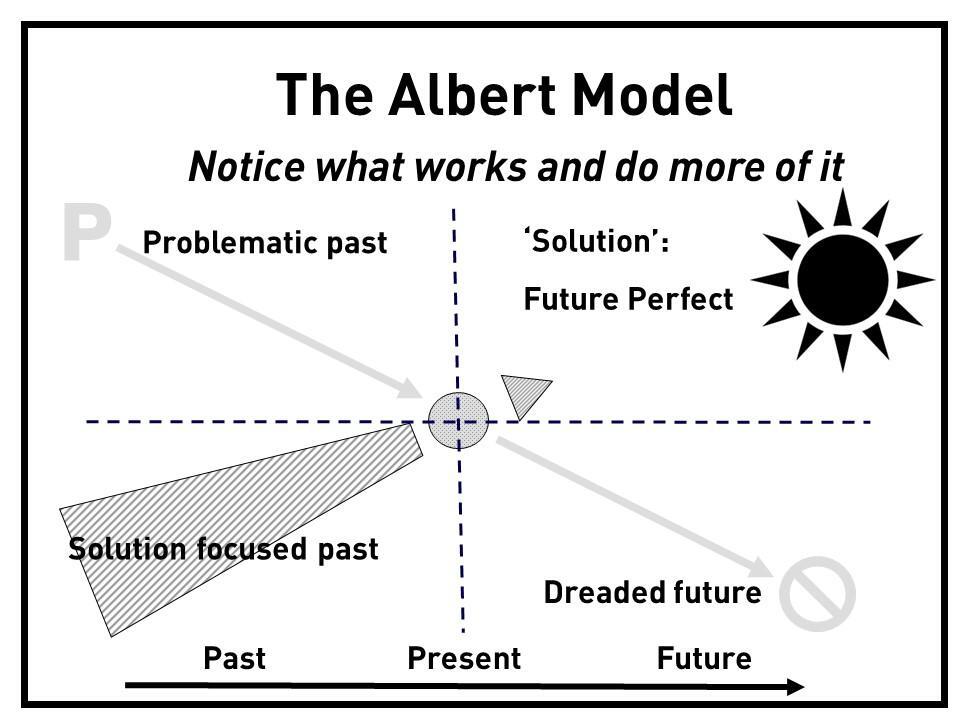
The Albert Model, which was still called “The Solutions Focus Model” in The Solution Focus 2nd edition (Jackson & McKergow, 2007, p. 3), went through a few iterations in the following editions of the book. The diagrams depicted above are from 2007, when the diagram appeared first in the second edition of the book, and from the most recent edition of 2024. The first edition of The Solution Focus book did not contain this diagram. Mark McKergow told me that he first drew this model in 2003 on a whiteboard during a seminar at the Said Business School in Oxford. He was showing it to Bristol Solutions Group colleagues later and one of them (Harry Norman) asked “What are you going to call it?” Mark was fond of using Albert Einstein’s unverifiable quote that “Everything should be made as simple as possible but no simpler”, and so he said (jokingly) “Albert!”. The name stuck.
It was the first published quadrant visualisation of Solution Focused practice and theory as far as I can tell. There were earlier attempts, such as the PLUS model of Michael Hjerth, which lived in conference presentations, but could not be found in a published format.
In Jackson and McKergow’s “The Solution Focused Model” only the x axis is labelled either as “time” (in the earlier versions) or, like above “past – present – future”. The y axis is not clearly definable – in the left half, the top is “problematic” (i.e. negative) and the bottom is “Solution focused” (i.e. positive) whereas it is the other way around in the right half. The beauty of depicting the SF process like this is that there is a straight line from solution focused past to future perfect and from problematic past to dreaded future which illustrated the two different possible trajectories for a conversation: you can pay attention to the problematic past and dreaded future, or you can pay attention to the solution focused past and the future perfect (the preferred future of the client). There is a small triangle pointing to the “Future Perfect” from the middle point in the diagram which illustrates the fact that in SF, there is no detailed plan from where the client is now (middle point) to the “Future Perfect” as every step of the way things may shift due to the complexity of the situation.
The strength of this diagram is that it illustrates SF theory in highlighting what is paid attention to, the possible flow of a conversation and a differentiation to problem focused conversation. By labelling the diagram as “Notice what works” in … rather than “find what works”, the later version is also consistent with the newer developments in SF which stress the importance of “description” (McKergow, 2016).
SF Matrix / Solutions Landscape (Schenck, 2006, p. 29)


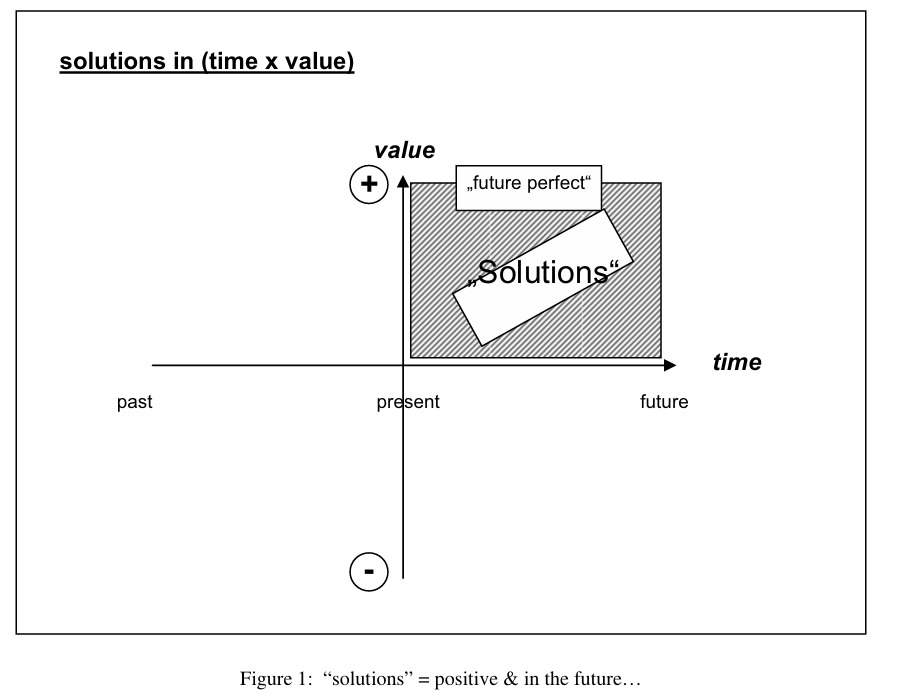
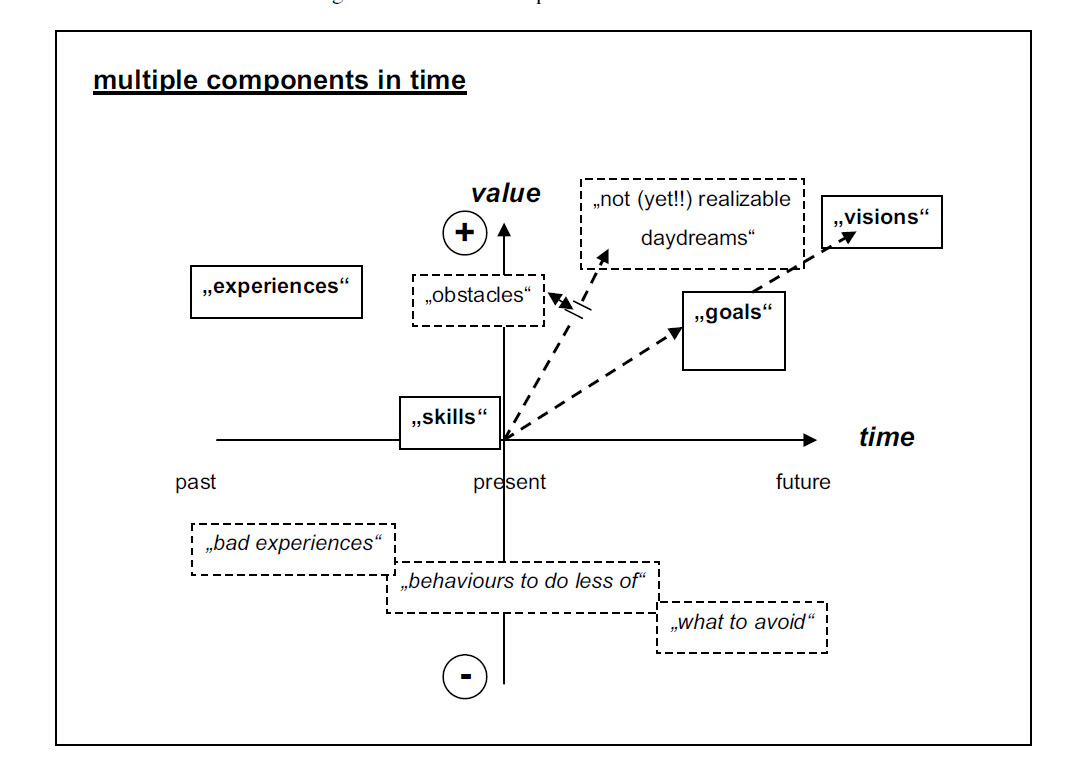
Klaus Schenk’s “SF Matrix” as it came to be known in later years was called “Solutions Landscape” in the original publication. It uses a similar structure as the Albert Model, however in this diagram both x and y axis can be labelled. The x axis is “time” and the y axis is “negative – positive”. In the top right corner, we find “solutions”. According to Schenk "Many ingredients may contribute to a solution: things, people, skills, past experience, money, energy, creativity…, collectively called resources. Resources and elements of the desired solution may be found in all times, all along the “time”-axis or “timeline”. Those from the past may be called “experiences”, those in the present “skills”, those from both the past and present “exceptions”, and those for the future “visions” or “goals” (Schenck, 2006, p. p.28), which he depicts in the second diagram.
While this model does not have a clear, straight line for the SF process, like the Albert model, it uses a two-by-two matrix structure familiar to many organisational consultants to map what is being paid attention to in the SF approach. The SF “plane” is clearly visible as the top half of the diagram. The strength of this model lies in the adaptability to organisational consulting and the clarity of depiction. Schenck also uses the model as a guideline for practitioners. He encourages them to invite their clients to speak about what is presented in the top half of the diagram: “It doesn’t really matter which quadrant of the map your client starts with - you can always find questions that point towards the upper right square, the solutions’ quadrant! […] The map can help to give orientation where the client stands, and what kind of question to select to support focusing positive possibilities and resources.” (Ibid, p. 30)
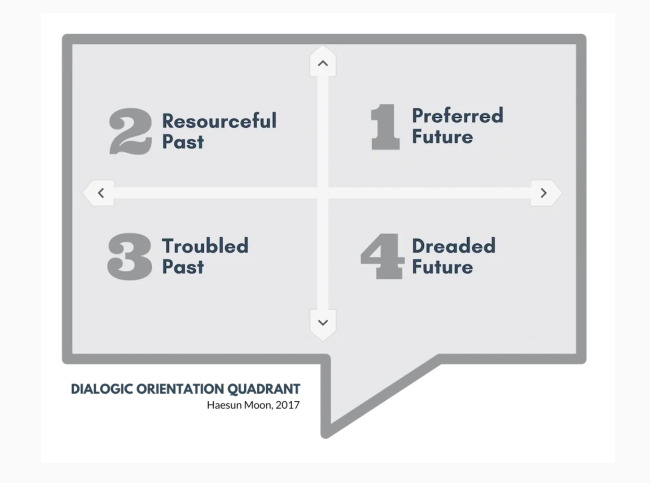
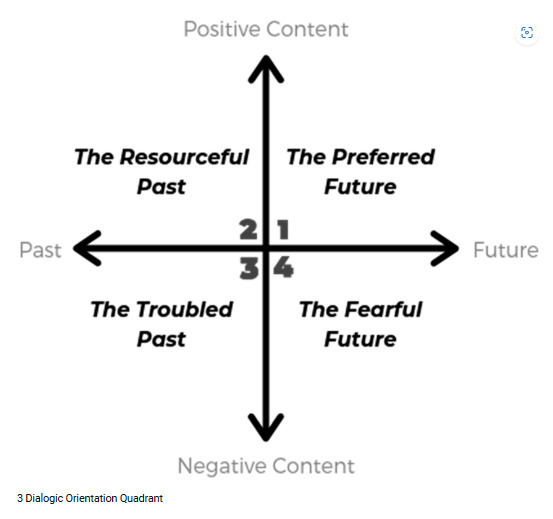
Dialogic Orientation Quadrant (Moon, 2017, 2020, p. 252)

.png)
Haesun Moon’s “Dialogic Orientation Quadrant” popularized the structure originally designed by Klaus Schenck. Her diagrams (Moon, 2017, 2020) combine language of the Albert Model (Jackson & McKergow, 2007) “dreaded future” and the structure of Schenck’s Solutions Landscape (Schenck, 2006). The difference between Jackson & McKergow’s quadrant and Moon’s dialogic quadrant is that in Jackson & McKergow’s quadrant, the solution axis is going “Up” and the problem axis going “Down”. Moon and Schenck’s orientation is a traditional four field matrix, which makes acceptance in management circles easier, while Jackson & McKergow’s quadrant is visually more appealing as the “positive” movement is going “up”.
In her article “Coaching: Using Ordinary Words in Extraordinary Ways” Moon claims that she is providing “a new framework of coaching, derived from a Solution-Focused, interactional perspective, and offer practice-based way to understand ‘how coaching works’.” (Moon, 2020). Her quadrant is framed as a “simple heuristic of interaction […] intended to make the inductive observation of a coaching conversation simpler to organize.” (Ibid, p. 251). Moon combines the research of Janet Bavelas on microanalysis, Solution Focus and social constructionist thought to illustrate fundamental orientations of coaching conversations. Like Schenck, she quotes Korzybski saying that “the map is not the territory” (Ibid, p. 253).
The “Dialogic Orientation Quadrant” focuses on the observation of coaching practice and is structured exactly like the earlier “Solution Landscape” by Klaus Schenck (Schenck, 2006) so the same observations hold as mentioned above. Moon is clearer on the social constructionist foundations and integrates Microanalysis in her article.
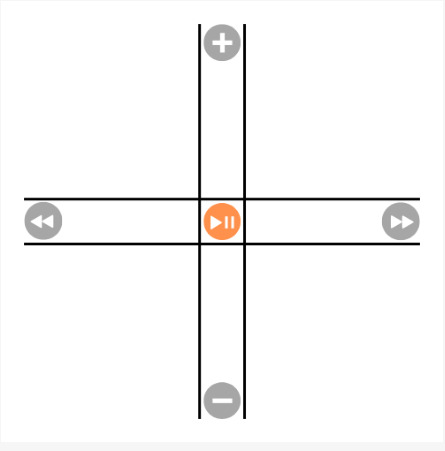
Lösungskreuz (Küchler, 2021)
__2020.png)
In German-language practice, Küchler introduced the Lösungskreuz (“Solutionscross”), a cross-shaped visualisation of conversational orientations, which is structured like Schenck’s “Solution Landscape” (Schenck, 2006), albeit with a clearer visual design. It is quite minimalistic, offering the practitioner a very easily understandable “map” for the conversation. Küchler quotes Haesun Moon as his inspiration (Küchler, 2021).
Instead of using words to describe the quadrants, Küchler uses symbols: a plus sign and a minus sign on the vertical axis and a fast forward and fast rewind symbol on the horizontal axis. The minimalism of this diagram fits well with the minimalistic aesthetic and ethos of SF theory and practice. However, when using this diagram in training, students probably need explanation to use it. The old visualisation adage: “A picture is worth a thousand words but should not require them” comes to mind.
Solution Loop (Küchler, 2023)
.png)
Moving beyond quadrants, Küchler developed the Solution Loop, a circular model highlighting iterative cycles. Küchler quotes the psychology of motivation, PSI theory, the Zurich Resource Model and Acceptance and Commitment Theory as his inspirations, which raises eyebrows due to their theoretical incommensurability. The diagram depicts the fluidity of a conversation between positive / negative and past / future, which is very much in line with SF or social constructionist thinking about conversations in general. Again, this diagram is very minimal. It is also one of the first visualisations which foreground the fluidity of the SF process.
Comparative Note: Quadrant models offer theoretical clarity and appeal to audiences accustomed to frameworks. They are especially useful in organisational and academic settings. They are a handy tool for observing conversations, inviting clients to talk about positive futures and positive pasts and thus also for teaching and learning SF. Jackson & McKergow (2007) integrate a differentiation from problem focused approaches, Küchler adds a depiction of the fluidity of the conversation.
Flow and Process Models
Flow and process models emphasize conversational movement and process. They are particularly popular in training and practice when beginning practitioners of SF are asking for a structure for their conversations. Whereas this structure can offer security for beginning practitioners who are looking for a “how to”, they carry the danger of oversimplifying and solidifying a fluid and emerging practice.
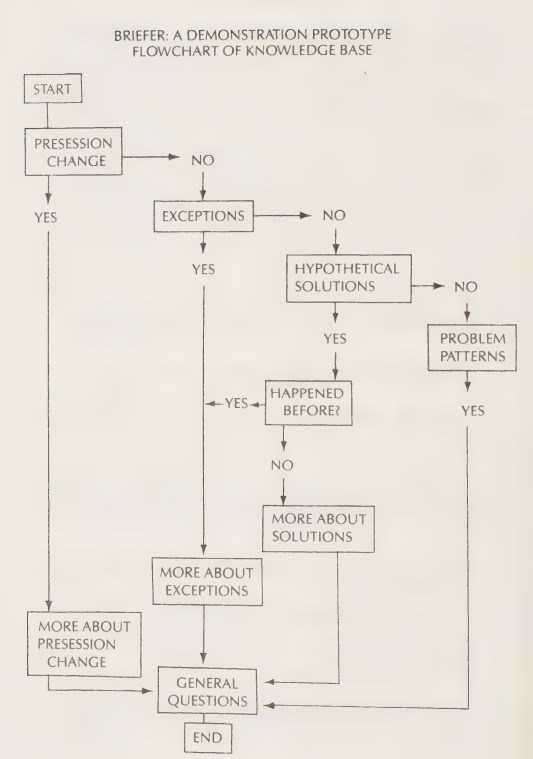
Clues (de Shazer, 1988, p. 34)
.png)
The first attempt at a visualisation of the SF process as a flow chart was within the framework of the “Briefer Project” in which Steve de Shazer attempted to create a decision tree for SF practice. In this diagram, you can see what guides the decisions of a practitioner in a conversation. If the client talks about presession change, the practitioner will ask more questions about presession change. If not, they will ask about exceptions. If there are no exceptions, the practitioner will enquire about hypothetical solutions, etc. This is all followed by “general questions”.
This first flowchart diagram visualises practitioners’ strategic decisions within an SF conversation. It is quite complicated and also suggests that there is a fixed structure of an SF conversation which is something that more current versions of the practice have eschewed in exchange for more fluidity, flexibility and partnership with the client.
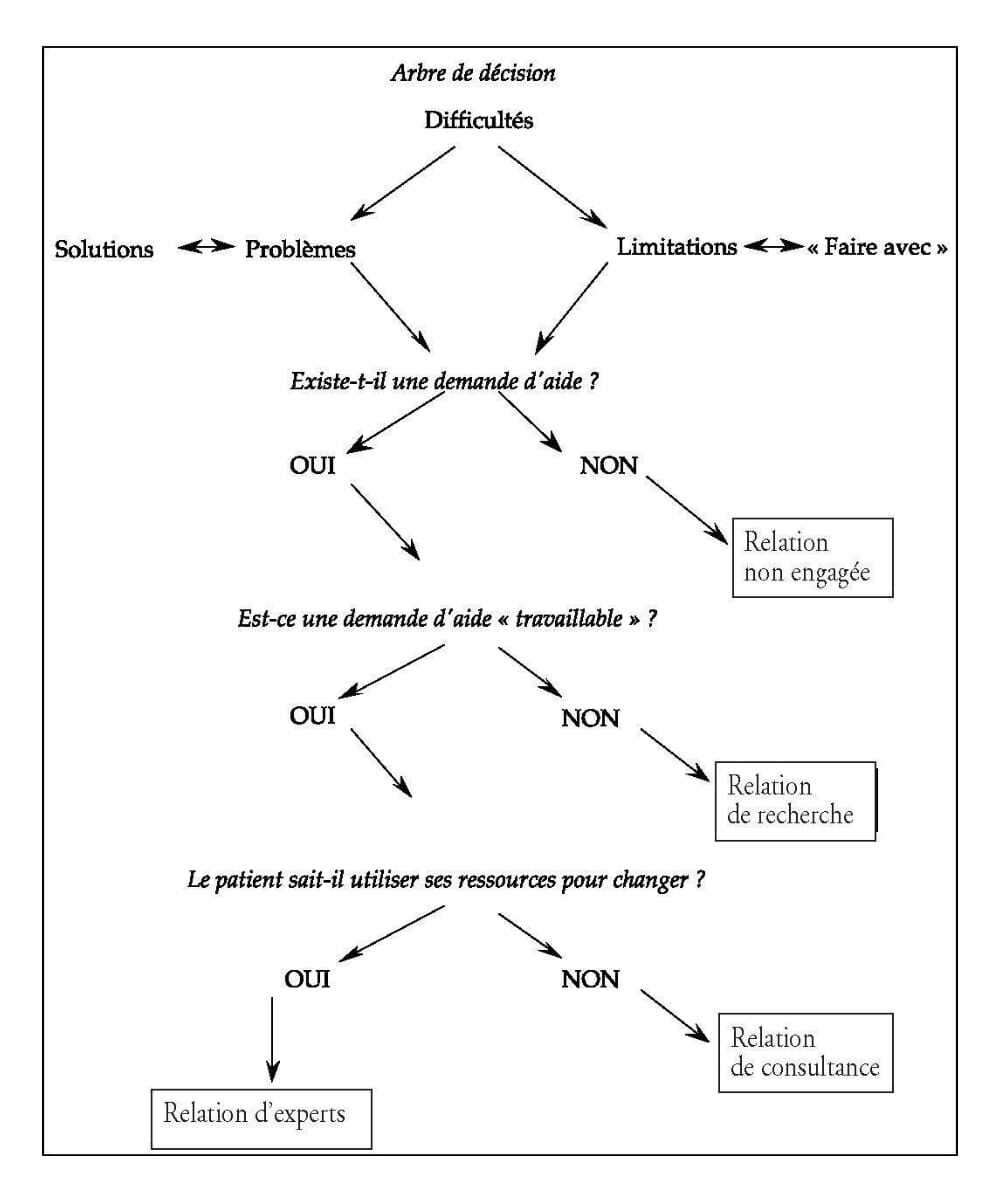
The Bruges Flowchart (Isebaert & Cabié, 1997, p. 116)
.jpeg)
The Bruges Flowchart was first developed by the Korzybski Institute in Bruges, Belgium and is also cited in Cauffman & Dierolf “The Solution Tango” (2006), unfortunately without a direct citation of the original. Rather than focusing on the SF process, this flowchart depicts a decision tree for the practitioner to “give the practitioner some examples of possible interventions” (p. 116, translation by the author). The authors stress that the designations like “experts” or “consultants” are not descriptive of the clients (staying away from diagnosis) but of the relationship between client and practitioner. Knowing the type of relationship can help a practitioner to “not go too fast and avoid certain untimely interventions” (p. 116, translation by the author).
The guiding questions are:
-
Is the difficulty a “problem” which can have a solution or is it a “limitation” which the client cannot change but needs to live with.
-
Is there a request for help, yes or no. If there is no request for help the relationship is termed a “not-engaged relationship”. These are clients, who, for example, wish someone else to change rather than themselves.
-
Is there a workable request for help, yes or no. A workable request would be one that is sufficiently precise (Ibid p. 115) and within the scope of agency of the client. If there is no workable request, the relationship is called “search relationship”.
-
The next question is whether the client knows how to use their resources to change. If they do, the relationship becomes an “expert relationship” and if they do not a “consultation relationship”. In a consultation relationship, the practitioner may suggest resources, in an expert relationship, the practitioner will help the client apply their own strategies.
The different levels of relationships continue to be taught at Korzybski institute but have slipped out of fashion elsewhere. The danger of this flowchart is that it creates an analytic view by the practitioner which can, even if it is about the relationship between practitioner and client, morph into a diagnostic stance. This was expressly not intended by Isebaert and Cabié. The idea that certain relationships allow for different conversations is interesting. The question of whether or when to “give advice” to a client comes up often in coach training and this flowchart can provide a differentiated answer.
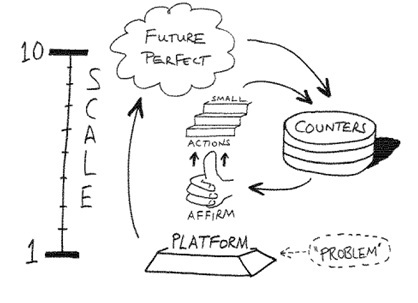
Solution Tools (Jackson & McKergow, 2002, 2007, p. 18)
.jpg)
This flowchart starts from “problem”, in quotation marks and in within a dotted circle. This already signals that “the problem” does not need to be talked about much in an SF conversation. The first no-dotted item is the platform, “a point of departure for our process of searching for what works.” (Jackson & McKergow, 2007, p. 18). The next item is the “Future Perfect”, a description of the preferred future without the problem. Next is “Counters”, all the resources, skills, know-how and expertise (Ibid) which line up on a scale which we can see depicted on the left side of the diagram. The scale overarches the whole flowchart from 1 (the level of the problem) to 10 (the level of the future perfect). The last two items are “Affirm” and “Small Actions”.
The pragmatism and clarity of this diagram is appealing. It gives beginners a clear view of how to possibly structure a conversation. Today, “Small Actions” would most probably change to “description of signs of progress” (McKergow, 2016). The risk of a described standard process is that SF might be understood as a prescribed sequence of tools rather than a relational philosophy. Mark Mckergow (private conversation, 2026) told me that the publisher insisted on the arrows in the diagrams whereas Jackson & McKergow were well aware of the dangers of showing a standard sequence.
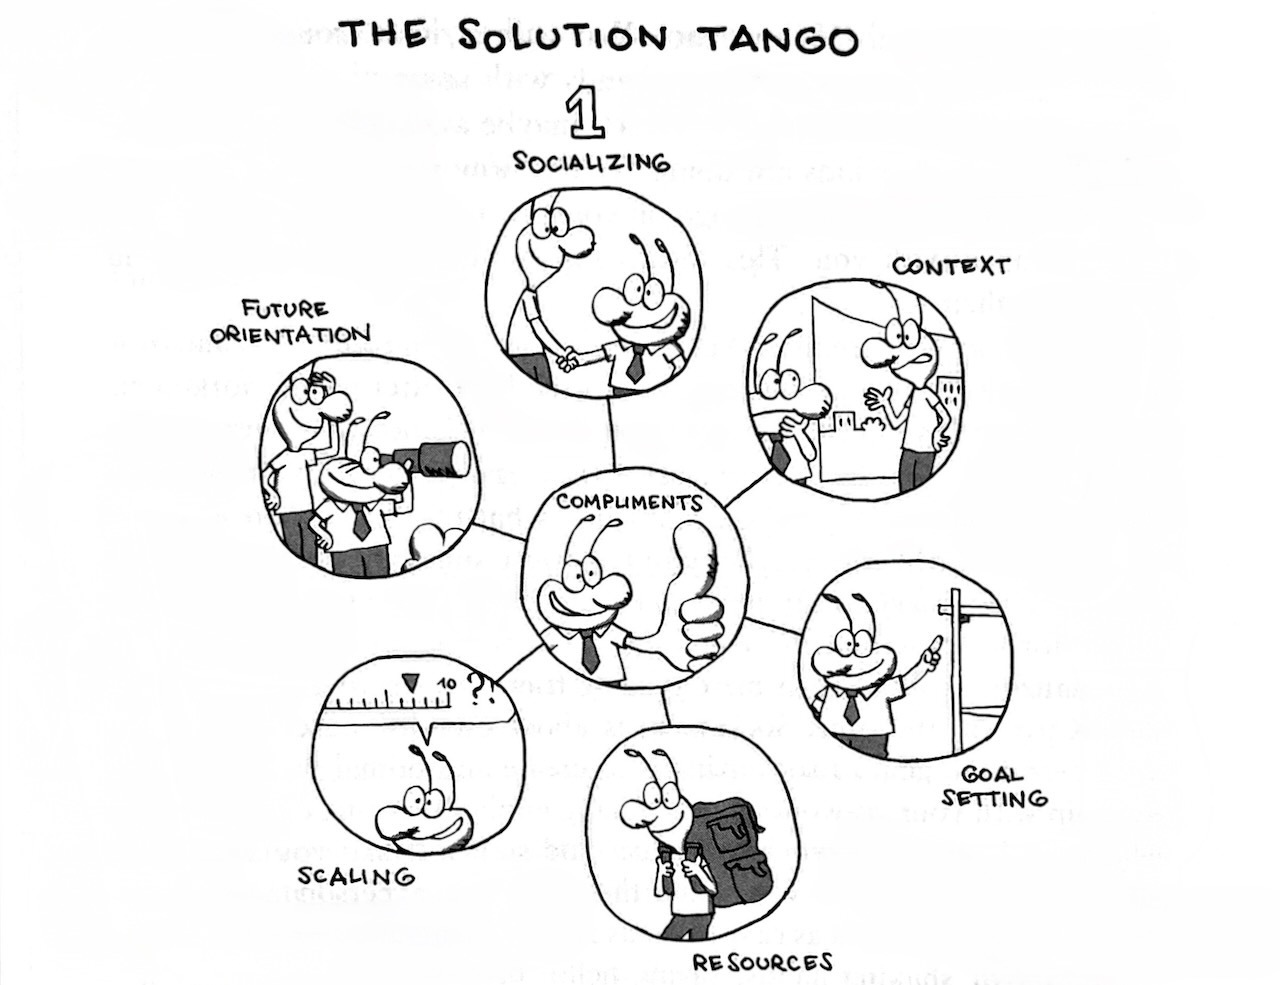
Solution Tango (Cauffman & Dierolf, 2006, p. 47)
.jpeg)
The Solution Tango likens SF practice to a non-choreographed dance with two partners (a leader and a follower). The leader extends invitations, and the follower follows (or not). The metaphor of a “dance” stresses the co-creation between practitioner and client in line with the social constructionist philosophy on which SF is built. The diagram centres “compliments” and organizes other “tools” around it. In the descriptive text (Cauffman & Dierolf, 2006, pp. 47–111), we can find a seven-step structure, which is not intended to be sequential.
-
Socializing
-
Contextualizing
-
Goal-Setting
-
Uncovering Resources
-
The Art of Giving Compliments
-
Offering Differentiation by Asking Scaling Questions
-
Future Orientation
The diagram – if not taken as sequential steps – offers an overview of possible SF interactions. The overview can be taken as a “menu” from which practitioners of SF can chose during a conversation. It stresses the importance of “compliments”, loosely translatable as “appreciation” and offers the practitioner flexibility.
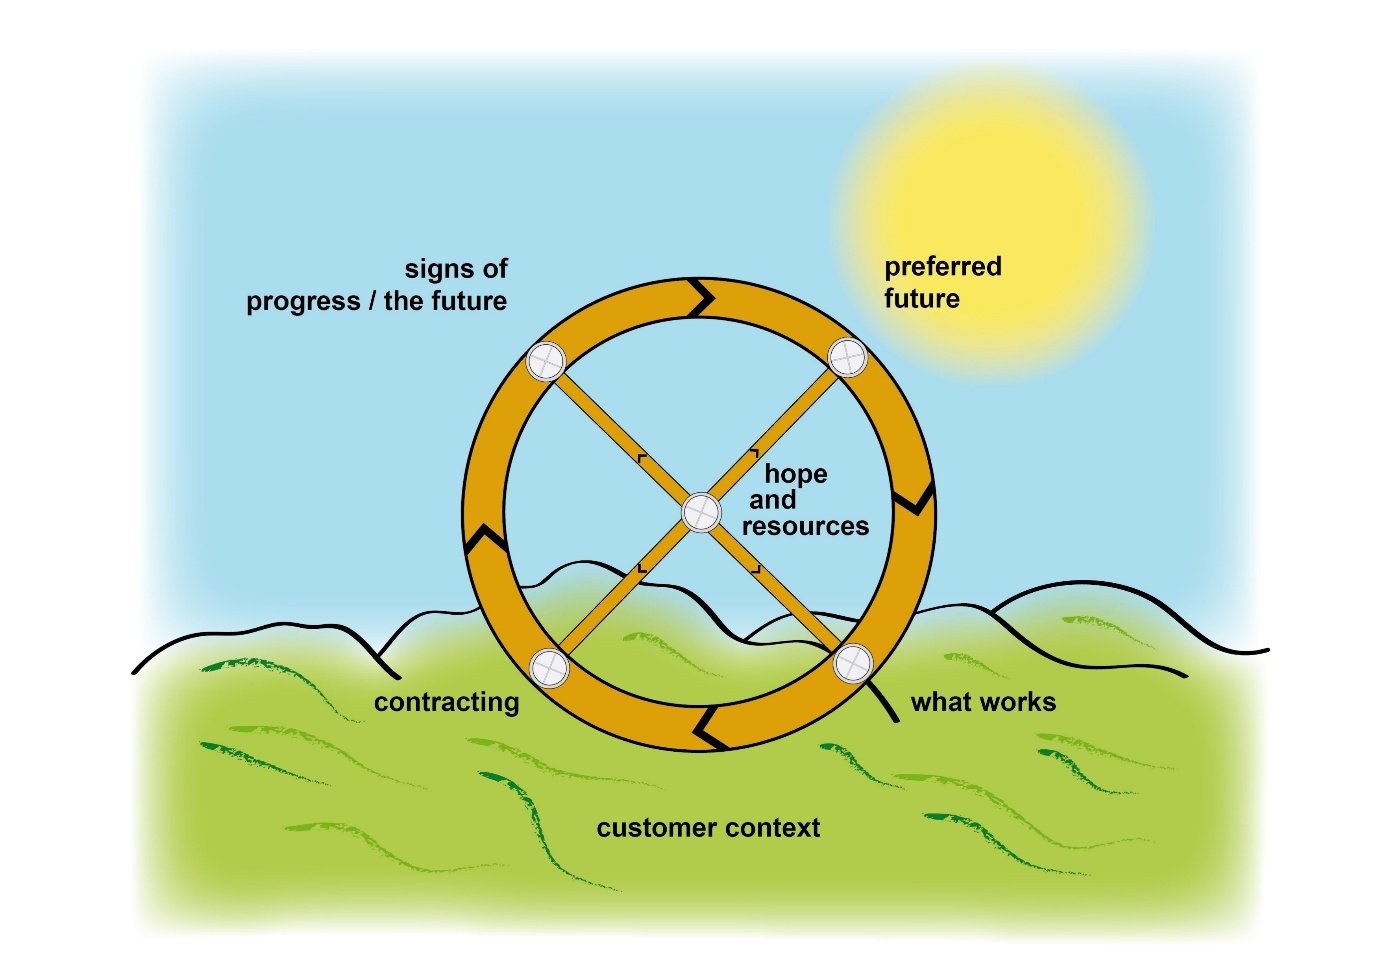
SF Wheel (Burgstaller, 2015, p. 98)
.jpeg)
The SF Wheel (Burgstaller, 2015) is a circular model emphasizing systemic and iterative dimensions of SF in organisations. The wheel reflects SF’s recursive nature. It differentiates the ground and the sky, with the sun being identified as a hopeful “Preferred future”. On the wheel, we can find the customer context in the ground and as a first starting point toward moving upward into the sky, we have contracting. After that, signs of progress / the future, the preferred future in the sun, hopes and resources moving downward and “what works” back in the ground.
This diagram includes both movement and a differentiation of two different plains – one belonging to the customer context (context and what works) and one belonging to the interactions between practitioner and client(s). As with all flowcharts, the danger is that SF is reduced to a process that needs to be followed. The addition of two plains is innovative and interesting.
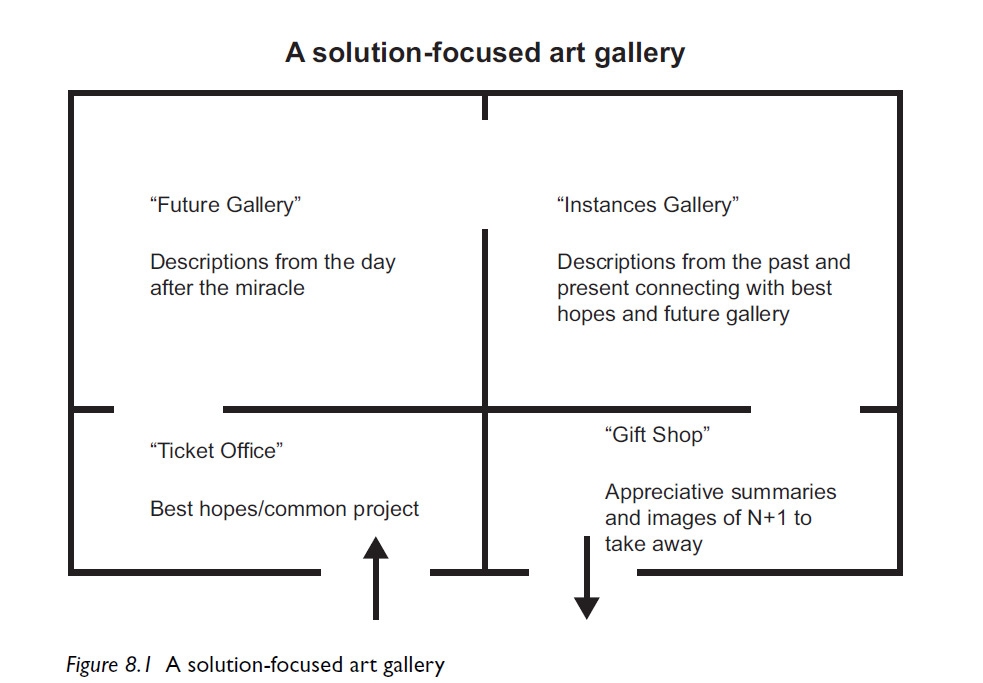
Art Gallery (Iveson et al., cited in McKergow, 2016, p. 113)
.png)
The solution-focused art gallery likens an SF conversation to a visit to an art museum. Client and practitioner enter through the “Ticket office”, move freely through “Future Gallery” and “Instances Gallery” to exit through the “Gift Shop”. McKergow states that “the point of this metaphor is that once inside the gallery (with a ticket or project), the rooms may be visited in any order, and different amounts of time spent in each room. […] This is not a route map but a guide to what will inevitably be an individual journey.” (McKergow, 2016, p. 112). The gallery serves both to keep track on what is going on in the conversation. Unlike Schenck and Moon, the Art Gallery only focuses on the conversational topics that might occur in an SF conversation and does not mention which topics will not be invited. This is due to the purpose of the “Gallery Metaphor” – it is designed for students and practitioners of SF. Another innovative element of the metaphor of the gallery is moving away from “tools” and questions toward focuses of conversation. It also highlights the descriptive element of SF practice: In each room the client is invited to describe rather than explain; each description can be likened to an individual picture on the gallery wall.
Moving from tools to descriptions is very much in line with the more recent elements of SF practice. The “Art Gallery” visualisation allows practitioners to work in a loose structure and keep in mind the invitation for clients to talk about descriptions of positive past and future oriented at their objectives. It is both flexible and clear and does not fall into the trap of over-structuring SF practice. With the “Art Gallery” metaphor every practitioner can find their own way of invitations to clients.
SF for Chronic Pain (Valusek, 2021, p. 15)
.jpeg)
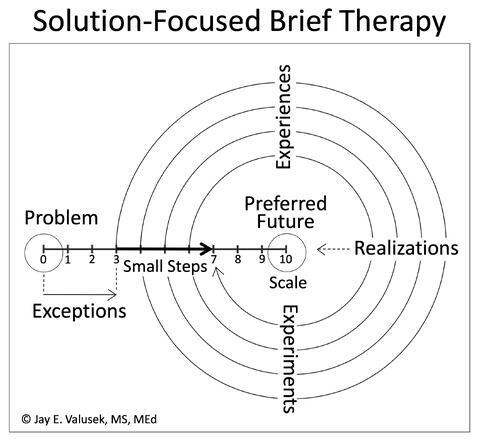
Jay Valusek’s visualisation of SF for chronic pain uses the metaphor of a circle. In the centre, we find the “preferred future” with a 10 on the scale. On the opposite end, we have 0 with “Problem”. Valusek uses SF for helping clients with chronic pain and deliberately “places the patient’s ‘preferred future’ at the centre of a dynamic, iterative process.” (Valusek, 2021, p. 15) Focusing on exceptions rather than instances of pain and being invited to notice their own solutions and by designing their own experiments, clients move toward their preferred future in a circular motion.
This diagram focuses on the process of scaling but does so in a circular motion rather than in the usual straight line. It stresses the iterative aspect of “experiencing”, “realizing” and “experimenting”. The preferred future is centred, however, there is no mention of a focus on its exploration. The diagram is clear and simple and seems useful for explaining an SF process to more problem focused practitioners and clients without burdening them with too much theory (on the practice).
Lösungspyramide (Miarka & Jungwirth, 2022, p.63)
__2022.png)
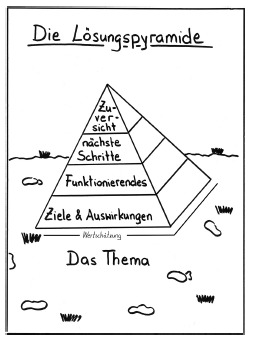
Miarka and Jungwirth’s “Lösungspyramide” (Solution Pyramid) illustrates the SF process as founded on “the topic” (das Thema) and “Wertschätzung” (appreciation). The various layers of the pyramid are: “goals and consequences”, “what is working”, “next steps”, “confidence”. Miarka and Jungwirth state that “Every solution-focused conversation essentially goes through four phases.” (Miarka & Jungwirth, 2022, p. 63).
The shape of a pyramid suggests something solid and unchangeable. SF is reduced to a four-step approach and it remains unclear why the shape of a pyramid was chosen except to signify that every conversation rests on a ground consisting of “the problem and all the experiences that have already been made with it.” (Ibid) This diagram runs risk of taking “the problem” as the foregrounded reason for the conversation whereas SF generally invites a focus on what is wanted rather than what is not wanted. It also remains unclear why the shape of a pyramid was chosen except, maybe for branding reasons in an attempt to differentiate the diagram from other existing models.
SF Brief Therapy Diamond (Connie & Froerer, 2023, p. 100)
.png)
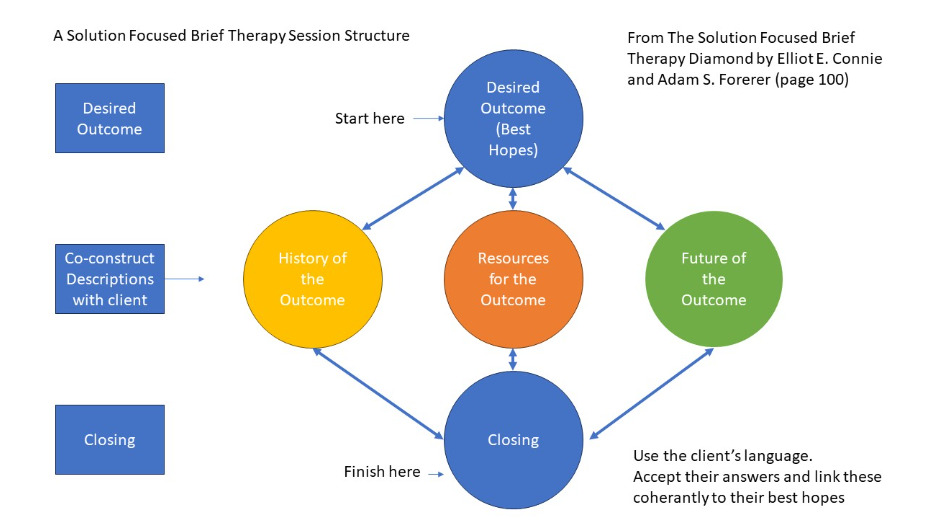
The authors Elliot Connie and Adam Froerer start with a bold claim: “The diamond model is one of the biggest innovations in the field of solution focused brief therapy. It’s a flowchart that comprises the five skills you need to master to do solution focused brief therapy effectively. It guides you through every moment of a session, so you’ll never get lost in a session again. You’ll know with absolute clarity where you are, where you’ve been, and what comes next.” (Connie & Froerer, 2023, p. 95). This kind of language is reminiscent of modernist therapy approaches where the practitioner is the expert for the process of the session. The practitioner has “skills” which they “master” to “not get lost” in the session. Therapeutic practice becomes something the practitioner does to the client rather than something that is co-constructed, which to my mind is not representative of the social-constructionist SF philosophy and ethos.
If we ignore the marketing language, we can see that, the diamond flowchart does allow for co-creation. In this visualisation, the “Art Gallery” model with four rooms is reduced to three steps with choices of “history of the outcome”, “resources for the outcome” and “future of the outcome” in between “desired outcome” and “closing”. In comparison with the “Art Gallery” model the focus on description (of the pictures in the exhibition room) of observable behaviour, an important part of SF practice is less clear – this is mentioned in the side bar. The diamond model itself stresses the fluidity of the co-construction between practitioner and client (which makes the marketing rhetoric ever more unfortunate). It aids the practitioner in loosely structuring the conversation while maintaining a focus on descriptions rather than explanations.
Comparative Note: Flow models evolved from simple toolkits in the late 1980s to metaphor-rich, systemic, and domain-specific diagrams in the 2010s and 2020s. They excel at accessibility but risk oversimplification. Each diagram has their own strengths and weaknesses and is adapted to its context (for example the Lösungspyramide for Agile Coaches or Valusek’s spiral for working with chronic pain).
Critical Reflection
Functions of Visualisations
Visualisations create memorable messages, simplify complexity, evoke metaphorical qualities, and structure practice. They help differentiate SF from other approaches and provide points of comparison. They also support dissemination and professionalisation, signalling legitimacy in academic and professional contexts.
Structure Versus Emergence
Visualisations impose structure on an emergent process. Linear models risk checklist-like interpretations while allowing beginners an “illusion of predictability” which can be very helpful when learning a new model. This reflects a broader challenge: balancing accessibility with fidelity.
The Role of Metaphor
Metaphors such as tango, wheel, gallery, pyramid, and diamond are pedagogically powerful. They connect abstract practice to embodied experiences but also introduce unintended associations (e.g., hierarchy in pyramids). Trainers in SF should frame metaphors critically to prevent misinterpretation.
Audiences and Uses
-
Novices: diagrams provide scaffolding and reduce anxiety.
-
Trainers: serve as teaching anchors, stimulating discussion.
-
Experienced practitioners: may find diagrams reductive or constraining.
-
Clients: visualisations can support reflection but risk diverting attention from lived experience.
Epistemological Tensions
SF’s founders emphasized minimal theory (about clients). The proliferation of diagrams reflects professional needs for teaching and dissemination but risks diluting SF’s radical simplicity. Visualisations thus embody an epistemological paradox: necessary for pedagogy yet potentially undermining the philosophy they represent.
Implications
Practice
Practitioners can use diagrams as orientation tools but should treat them as maps, not territories. Overreliance risks rigidity. Experienced practitioners may use them selectively, adapting metaphors to clients’ contexts.
Education and Training
Diagrams may be useful in training. Often beginning students are happy to have a model to follow, like a scaffold that they can discard as they get more fluent. Trainers can enhance learning by exposing learners to multiple models, emphasizing their metaphorical and partial nature. Using contrasting models in discussion can foster critical thinking rather than dogmatic adherence. Ultimately, SF trainers want to encourage every practitioner to fill SF practice with their own way of interacting with clients (in an SF way) and not with a flowchart of things to say.
Conclusion
Over the past two decades, visualisations of SF practice have proliferated. Quadrant models provide theoretical clarity, while flow and process models offer pedagogical accessibility. Both have enriched SF teaching and dissemination, yet both carry risks of oversimplification and distortion.
Practitioners, trainers, and researchers should approach visualisations critically and use them as scaffolds, not prescriptions. Future research and design efforts may yield visualisations that better capture SF’s emergent and client-led nature, perhaps through dynamic, interactive formats.
Ultimately, visualisations will remain part of SF’s pedagogical landscape. Their value lies not in providing definitive representations but in sparking reflection, dialogue, and learning. Used critically and creatively, they can enhance rather than constrain the practice of SF practice.