
Introduction
Solution-Focused Brief Therapy (SFBT) is an evidence-based therapeutic approach designed in the 1980s by Steve de Shazer and Insoo Kim Berg. SFBT is a method that emphasizes the client’s strengths and resources to create positive changes, focusing on the present and future rather than on past problems (Chen et al., 2024). Unlike other therapeutic approaches that seek to identify and analyze issues, pathology, and explore an individual’s past, SFBT aims to understand ones’s best hopes and preferred future (Iveson et al., 2012). Instead of discovering weaknesses, breaking resistance, or challenging a client’s core beliefs, it seeks to uncover strengths and capabilities, exceptions to problems, as well as the positive actions that clients are taking in the present (De Shazer et al., 2021). SFBT is recognized by several key principles: 1) in this therapeutic approach, clients are considered experts in their own lives with the ability to achieve their goals, 2) therapists listen carefully to client’s words to discover their unique language (the use of language is heavily emphasized in this method), 3) SFBT emphasizes resources, strengths, abilities, and successes, and 4) it is a future-oriented approach that invites clients to provide a detailed description of their own preferred future (Iveson et al., 2012).
This method is widely used in coaching as well as psychotherapy (Roeden et al., 2011). Indeed, research indicates that Solution-Focused Brief Therapy, alongside Cognitive Behavioral Therapy and Bowen’s Systemic Family Therapy, is among the top three interventions used by family therapists in United States (Bradley et al., 2010).
The theoretical basis of Solution-Focused Brief Therapy (SFBT) is formed by a Solution-Building thinking, and research shows that SFBT enables individuals to experience positive emotions more effectively and easily by changing their way of thinking (Gingerich & Peterson, 2013). The fundamental hypothesis of the Solution-Focused approach is deceptively simple. It assumes that individuals possess the necessary resources to solve their problems, and that during coaching or therapy sessions, it is more beneficial to spend time identifying solutions and focusing on pathways to achieve the desired state rather than examining the root causes of the problem or the thought patterns that create and maintain it (McKergow & Jackson, 2005).
Solution-Focused Brief therapy posits that change (action) depends on how clients think about change and how they articulate it (De Shazer, 1988). In other words, problems and solutions are not necessarily things that are presented in reality; rather, they are constructed in the discourse between the client and the therapist and within the context of solutions (Grant & Cavanagh, 2018).
Solution-Building thinking can be contrasted with Problem-Focused thinking. Problem-Focused thinking states that to solve a problem, one must necessarily uncover its underlying causes, whereas Solution-Building thinking avoids discovering and examining the causes of the problem, and instead focuses directly on how to create the desired change (Grant & Cavanagh, 2018). In fact, some in Solution-Building thinking believe that uncovering the causes and underlying complexities of a problem is a futile process, which can even limit the individual’s actions and ultimately undermine self-efficacy, motivation, and resilience (McKergow & Stellamans, 2011).
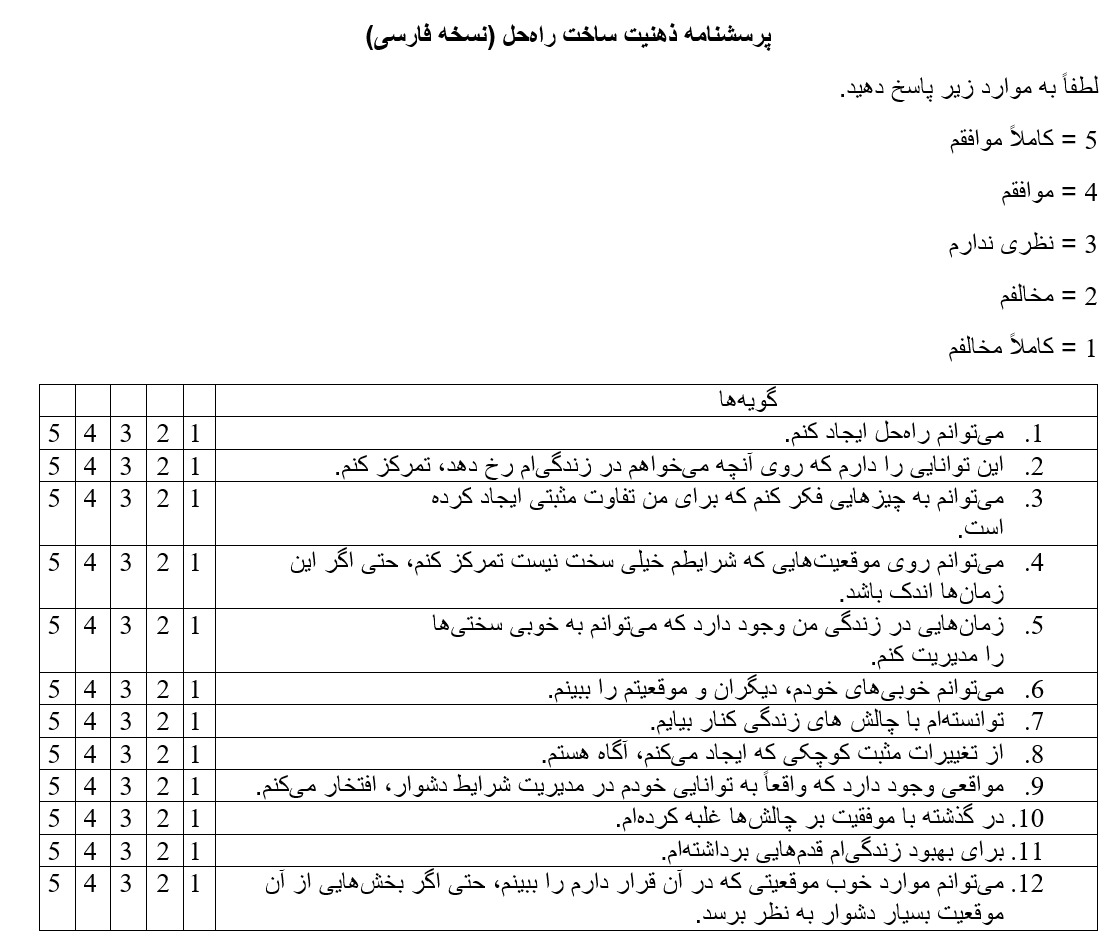
The Solution-Building Inventory (SBI) developed by Smock et al. (2010) consists of 14 items for measuring the Solution-Building process through an assessment of an individual’s Solution-Building thinking (Arslan et al., 2021). This inventory uses a 5-point Likert scale (1 = strongly disagree and 5 = strongly agree). The range of scores obtained is between 14 and 70, with higher scores indicating Solution-Building thinking (Arslan et al., 2021). This inventory has been used in United States (Smock Jordan, 2014), and has also been translated and validated in Turkish (Arslan et al., 2021), and Japanese (Takagi et al., 2015) studies. However, it had not previously been translated into Persian. Given the importance of introducing into Iran a valid tool for measuring Solution-Building thinking, researchers decided to assess the validity and reliability of a new Persian version (see below) of the Solution Building Inventory (SBI).
Methodology
The current research is a methodological study aimed to examine the psychometric properties of a translated version of the Solution Building Inventory (SBI) (Smock et al., 2010). The research population consisted of all students at University of Mohaghegh Ardabili during 2024, from which a sample of 287 individuals (193 female, 67.2%, and 94 male, 32.8%) was selected using cluster sampling.
The SBI was translated using the back-translation technique proposed by Brislin (1970). The professionals that carry out the translation procedure must to be knowledgeable about the study’s topic and the population (Tran, 2009). The Persian version of the inventory was created by two experts in Solution-Focused therapy and English language. Particular focus was placed on the Solution-Building thinking and the cultural traits of the Iranian people during the translation process. Dr. Mir Saeed Jafari, the official supervisor of Solution-Focused therapy in Iran, then examined the translated version and attested to its accuracy. Subsequently, Dr. Akbar Atadokht, a full professor of psychology, reviewed and updated the translation before approving it. Lastly, the Persian version of the SBI was translated back to English (by two experts in solution-focused therapy and the English language), and the back-translation was sent to Dr. Sara Smock Jordan (designer of the SBI) to review and confirm the accuracy of the back-translation. Dr. Smock Jordan confirmed that there is no difference between meanings. The inventory was then provided to 30 students at the University of Mohaghegh Ardabili, who were asked to express qualitatively their opinions on the content, clarity, readability, simplicity, and ease of understanding of the inventory items, as well as the ease of completing the tool. After collecting the student’s feedback and consulting again with Dr. Mir Saeed Jafari and Dr. Akbar Atadokht and the Dr. Sara Smock Jordan, the final Persian version of the Solution Building Inventory (SBI) was compiled. The original version of SBI shown in Table 1.
The target population of this research included students from three academic levels: bachelor’s, master’s, and doctoral programmes at the University of Mohaghegh Ardabili. Voluntary sampling was conducted within the faculties of psychology and educational sciences, literature and humanities, and engineering and technology. After obtaining authorization from the university’s research Vice-Presidency, the questionnaires were distributed online to students, who were able to complete them. The study’s inclusion criteria necessitated that participants be students at the University of Mohaghegh Ardabili, exhibit a willingness to partake in the research, and complete the questionnaires. Initially, the study’s purpose was conveyed to the participants, with assurances provided that all their information would remain confidential among the researchers, thereby facilitating their voluntary participation in the study. To collect data, the Persian version of the Solution Building Inventory (SBI), along with Positive and Negative Affect Scale, and Dispositional Hope Scale, was used. After gathering the questionnaires, the data were analyzed using SPSS version 27 and AMOS version 24 software.
Instruments
Solution Building Inventory
Smock et al. (2010) created the Solution Building Inventory (SBI) to assess people’s propensity for Solution-Building thinking (Arslan et al., 2021). The items on the SBI are designed to gauge an individual’s level of Solution-Building thinking. The 14-item inventory is one-dimensional and is rated using a 5-point Likert scale. Each inventory item has a score ranging from 1 to 5, with 1 denoting strong disagreement and 5 denoting strong agreement. People with higher scores tend to have more Solution-Building thinking. The original inventory’s Cronbach’s alpha internal consistency coefficient was 0.866; the study’s value was 0.83. The results almost matched the original inventory’s scores.
Positive and Negative Affect Scale (PANAS)
The Positive and Negative Affect Scale (PANAS) was created by Watson et al. (1988) with the intention of measuring people’s positive and negative emotions. Ten of the items are related to pleasant emotions, ten to negative emotions. These two sub-dimensions can be utilized as independent scales, and are not dependent on one another. A 7-point Likert scale is used to score the scale. Both the reliability analysis and fit indices of the scale indicated that the Cronbach’s alpha internal consistency value was satisfactory. The internal consistency of the scale for the positive and negative impacts was determined by Watson et al. (1988) to be 0.83 and 0.86 respectively. Golparvar and Javadi (2006) reported that the Persian adaptation of this scale demonstrates satisfactory validity and reliability, evidenced by a Cronbach’s alpha coefficient of 0.70 for positive affect and 0.77 for negative affect. These values for positive and negative effects in this study were 0.89 and 0.88, respectively, which is comparable to the original scale.
Dispositional Hope Scale
Dispositional Hope Scale (DHS), was created by Snyder et al. (1991) to examine people’s levels of dispositional hope. There are 12 entries on the two-dimensional scale. Of these, four are filler items that have no bearing on the final score. The total scores from each of the scale’s eight-point Likert scale sub-dimensions are added together to determine the scale’s overall score. Fit indices are sufficient, according to the scale’s confirmatory factor analysis, and reliability study revealed that the sub-dimensions and the scale as a whole are both dependable. The original scale’s Cronbach’s alpha internal consistency coefficient was determined to be 0.866. The Persian version of the Dispositional Hope Scale was validated by Babolan et al. (2011), and its reliability was assessed using the Cronbach’s alpha coefficient, yielding a score of 0.70. Our result was discovered to be 0.74 in our study, indicating that the reliability value is in line with the published data.
Results
In order to evaluate the construct validity of the current inventory, a confirmatory factor analysis was conducted. Prior to discussing the results of the factor analysis and the associated reliability assessments, the correlation coefficients between the overall inventory score and its individual items will be presented.
According to the data presented in the aforementioned table, the correlation among all items is both positive and statistically significant.
Consequently, at this stage, the relationships among all items are confirmed and regarded as acceptable. To evaluate the reliability of SBI, Cronbach’s alpha was employed to assess the internal consistency of the inventory, with the results detailed in Table 3. The overall Cronbach’s alpha for the inventory was determined to be 0.83. The overall Cronbach’s alpha signifies a good reliability for the total score of the inventory. Moreover, a review of the data in Table 2 reveals that the correlation of all items with the total score of the inventory is statistically significant at the 0.01 level, with the correlation coefficients ranging from 0.34 to 0.69, indicating acceptable consistency among the items of SBI.
Confirmatory Factor Analysis
Some preparation was done prior to data analysis. First, the frequency table was used to identify individuals who provided blank responses or incomplete coding in the data. No missing data points were discovered. A precondition, normality, was tested prior to data analysis. Kurtosis scores ranged from 0.287 to 1.439, while skewness values fell between 0.144 and -0.525 according to the one-way normality assumption test. A normal distribution is indicated by values in the (-2; +2) range (George & Mallery, 2010). The multivariate normality assumption was tested using the Scatter plot matrix. It was determined that the normality assumption was satisfied because the distribution had the shape of an ellipse.
This study qualifies as exploratory research; therefore, the acquired data were subjected to analysis through AMOS software, version 24, utilizing confirmatory factor analysis to investigate the psychometric properties of the inventory. Confirmatory factor analysis was executed employing the maximum likelihood estimation method. Through this analysis, various model fit indices were calculated, including the chi-square statistic, Comparative Fit Index (CFI), Tucker-Lewis coefficient (TLI), Goodness of Fit Index (GFI), Adjusted Goodness of Fit Index (AGFI), and Root Mean Square Error of Approximation (RMSEA). In evaluating the fit indices, particular emphasis was placed on indices that are less susceptible to the influence of sample size (Hu & Bentler, 1999). Hu and Bentler (1999) recommended against a CFI lower than .90 due to risks of both Type I and Type II errors. Experts recommend that a value of 0.06 or lower for the Root Mean Square Error of Approximation, a value of 0.95 or higher for the Comparative Fit Index, and a value of 0.08 or lower for the Standardized Root Mean Square Residual (SRMSR), indicate an acceptable model fit (Hu & Bentler, 1999).
In contrast, when the comparative fit indices, goodness of fit, and adjusted goodness of fit exceed 0.90, while the root mean square error of approximation (RMSEA) and the root mean square residual are below 0.05, this suggests an acceptable model fit (Mohammadbeigi et al., 2015). The fit indices associated with the final iteration of the Solution Building inventory were thoroughly evaluated.
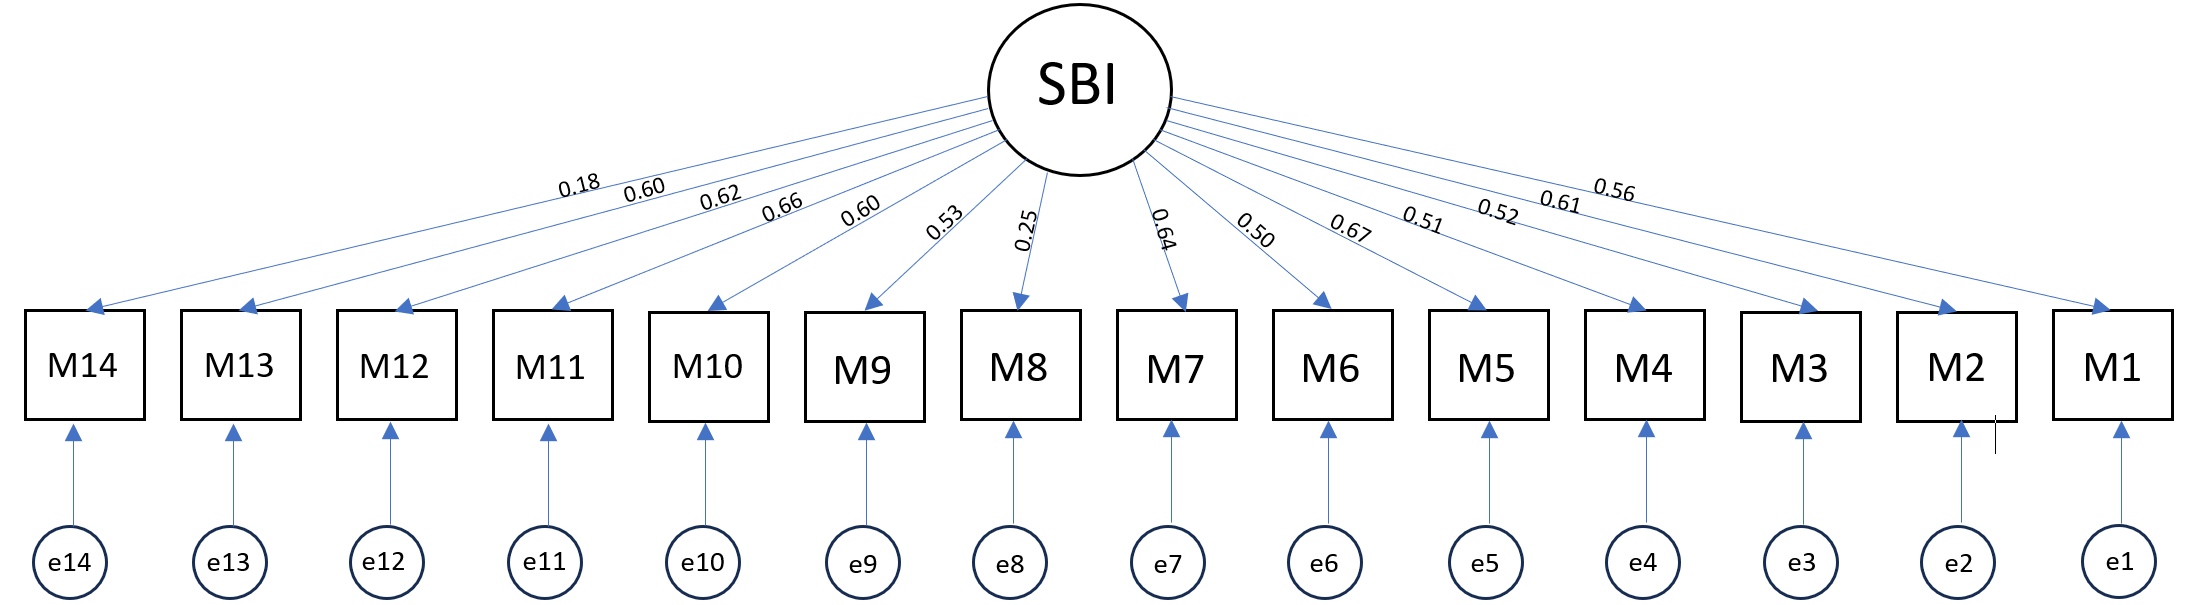
Based on the results of Table 3 for one-factor model with 14 items, χ²/df = 2.261 showed that it was a poor fit. Additionally, the results of the Two-factor model which is adopted by Arslan et al. (2021), were also evaluated in this study, and the results in Table 3, χ²/df = 2.582 indicate that this model is a poor fit.
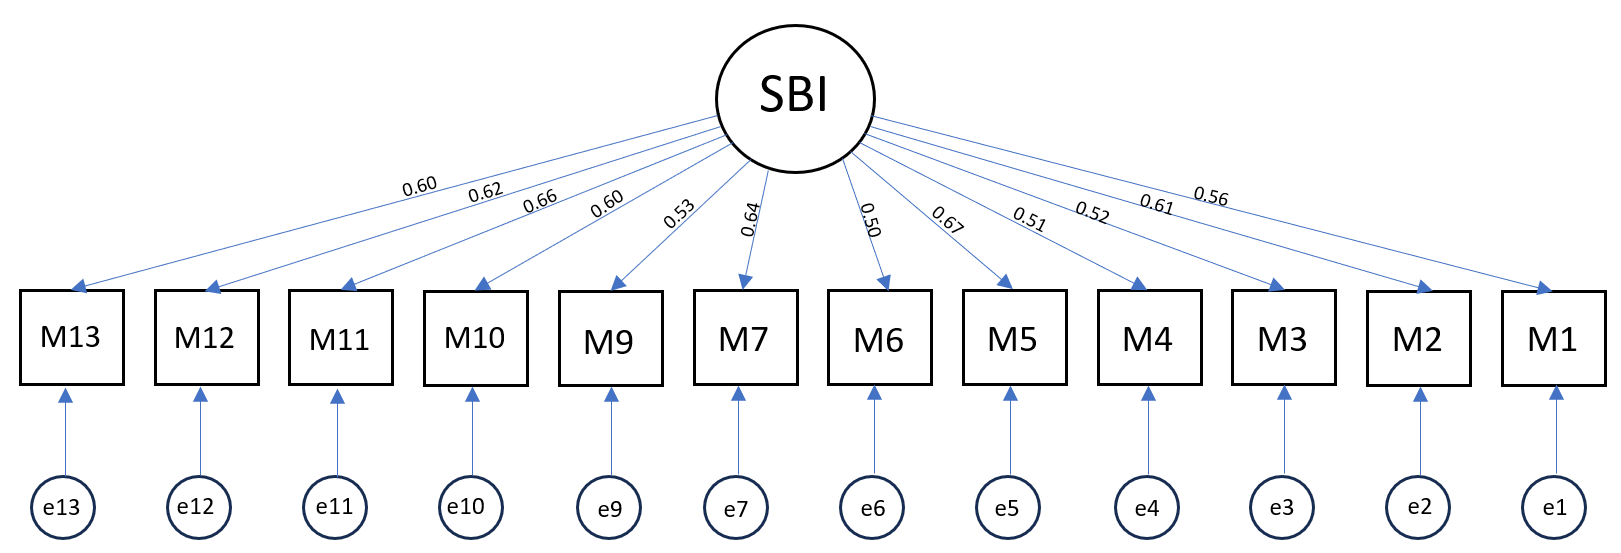
Finally, the results presented in Table 3 and Figure 1 demonstrate acceptable goodness of fit indices when comparing the data to the one-factor model with 12 items. In the current model, χ² = 112.026, df = 60, yielding a ratio of χ²/df = 1.867, which is considered acceptable (Tabachnick & Fidell, 2013). The comparative fit index (CFI), a value ranging from zero to one, was determined to be 0.951 in this model, a highly desirable outcome. The Goodness of Fit Index (GFI) and the Adjusted Goodness of Fit Index (AGFI) should be above 0.90 (Savalei & Bentler, 2006), and the values obtained for these two indices in the current model are acceptable. Tucker-Lewis coefficient (TLI) ranges from (but not limited to) 0 to 1 where a value closer to 1 represents a very good fit while 1 represents a perfect fit (Savalei & Bentler, 2006), and the values obtained for TLI in the current model is 0.926 which is acceptable.The root mean square error of approximation (RMSEA) provides insight into the average discrepancies between the observed covariance within the sample and the expected covariance estimations derived from the population. The RMSEA value found in this study is 0.055, indicating an acceptable fit between the model and the data. Additional fit indices are detailed in Table 3.
.png)
As demonstrated in the table above, the factor loadings for all items, excluding items number 8 and 14, are deemed acceptable and appropriate. The factor loadings range from 0.18 to 0.67, with item number 5 exhibiting the highest factor loading. Consequently, due to items number 8 and 14 inadequate factor loading, they will be excluded from the inventory, resulting in a final model of the Solution Building Inventory comprising 12 items.

Validity
To evaluate the validity of the current inventory, it was administered concurrently with the Positive and Negative Affect Scale, and the Dispositional Hope Scale. The variables were analyzed using the Pearson correlation coefficient.
As indicated in Table 4, the correlation between the Solution Building Inventory and Dispositional Hope Scale is r = 0.63, and with PANAS-p, it stands at r = 0.57, suggesting a positive and statistically significant relationship. Furthermore, there exists a negative correlation with PANAS-n r = -0.41, reflecting a negative and significant association. All correlations achieved significance at the p ≤ 0.01 level.
Discussion
The objective of the present study was to evaluate the validity and reliability of the Persian version Solution Building Inventory (SBI) among students at University of Mohaghegh Ardabili, while simultaneously comparing this instrument with parallel questionnaires (Positive and Negative Affect Scale, and Dispositional Hope Scale). This study seeks to address the question of whether this tool can effectively measure Solution-Building thinking.
The findings of this study indicate that the Solution Building Inventory possesses acceptable psychometric and statistical properties for the assessment of Solution-Building thinking. An analysis of internal consistency revealed a Cronbach’s alpha coefficient of 0.83 for the overall inventory, which is considered to be good consistency. The research results demonstrated that the scores derived from the Solution Building Inventory are based on a robust confirmatory factor structure, with all items, except two, exhibiting acceptable factor loadings. These findings align with those of Smock et al. (2010), Smock Jordan (2014), and Arslan et al. (2021), from previous studies.
In examining the validity of the Solution Building Inventory, the correlation between the SBI and Positive and Negative Affect Scale and the Dispositional Hope Scale was assessed. The results indicated a positive and significant correlation between the scores of the Solution Building Inventory and both PANAS-p, and Dispositional Hope Scale, alongside a negative and significant correlation with the PANAS-n. Individuals characterized by Solution-Building thinking tend to experience an increase in positive emotions and affective states, as this promotes the pursuit of practical solutions to challenges rather than fixating on the problems or their origins. Consequently, this fosters a sense of achievement and overall life satisfaction, which contributes to the emergence of positive affects within the individual. As positive affects such as happiness and hope are heightened, there is a corresponding reduction in negative affects, including depression, fear, and anxiety (Karahan & Hamarta, 2020; Koca, 2020). Moreover, an augmentation of hope and positive affects, coupled with a decline in symptoms of depression, anxiety, and stress—key indicators of mental health—serves to enhance life expectancy, as individuals aspire purposefully and optimistically towards the attainment of their goals while deriving fulfillment from the journey toward these objectives (Nikoogoftar & Dousti, 2021; Sepahvandi, 2021; Veiskarami & Roozbahani, 2018). Consequently, these results support the utilization of the Solution Building Inventory as an effective tool for the assessment of the Solution-Building thinking. Solution-Building thinking actively seeks to identify resources and capabilities while focusing on the development of healthy, logical, and pragmatic solutions, rather than solely diagnosing and addressing problems (Grant & Cavanagh, 2018). Research indicates that individuals who adopt a Solution-Building thinking approach demonstrate enhanced self-esteem, and experience reduced levels of depression, stress, and anxiety (Karahan & Hamarta, 2020).
Ultimately, the Solution Building Inventory developed by Smock et al. (2010) has demonstrated acceptable validity and reliability, positioning it as an effective assessment tool. The findings of the present study are consistent with those of the original research and additional studies that affirm the Solution Building Inventory’s validity in measuring a solution building process (Smock et al., 2010).
Limitations and Recommendations
A limitation of this study is that there were more female participants in the workgroup than male participants. It is advised that the validity and reliability evaluations of the scale be conducted on various samples in further research. Another limitation is the validation employing a student population, which also affects the generalisability of the findings. The link between the idea of Solution-Building thinking and other psychological and social elements should also be examined. Despite these shortcomings, the SBI (Appendix) has been demonstrated to be a brief, accurate, and valid assessment instrument for determining the degree of Solution-Building thinking among Persian people.